
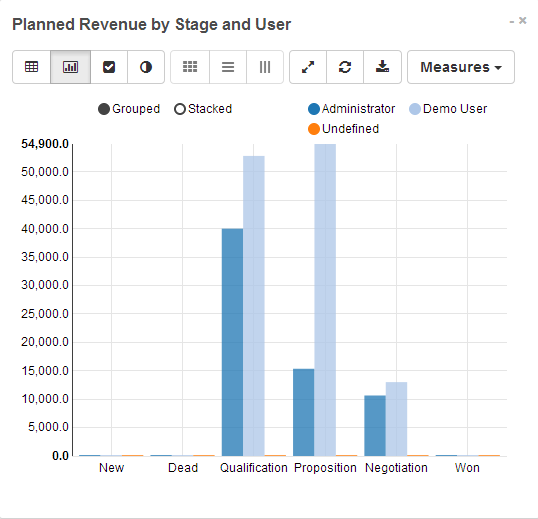
Odoo gives you an easy way to see the statistics about any of your important data.
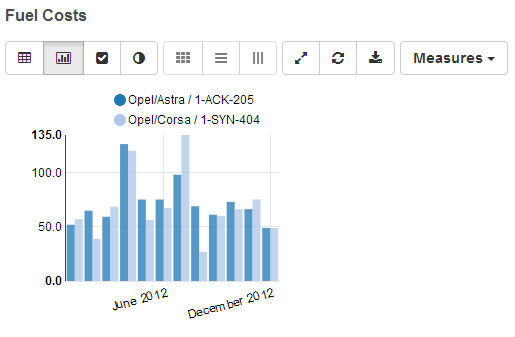
You can create detailed reports and graphs in any format you need - all that in few simple clicks.
No need for specialized program to create graphs and charts
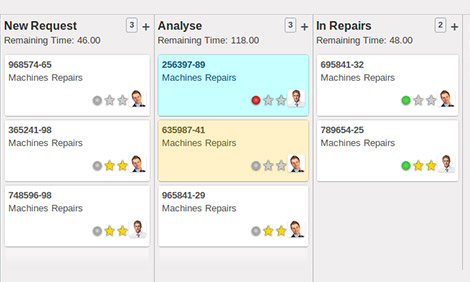
This amazing open source system offers you a feature that shows you the heat map, so you can easily understand the progress of all your projects and other activities. You can highlight the data - how many hours were spent on which project/task/etc. It's useful for tracking the progress and evaluation of each activity.
You can filter each analysis, with the sample filters or based on your own preference.
Easy way to get the exact information you need. You don't have to install any programs to create graphs and charts - everything can be done with Odoo's data analysis software.
Odoo's report creation software allows you to create specififed reports and analysis on the go - you can create all documents you need with few simple clicks; either from a template or with your own criteria.
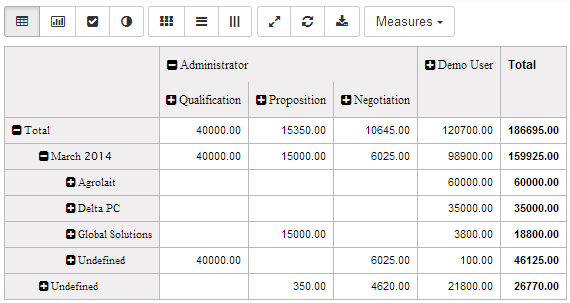
Track the process of each activity (project, report, invoice,..) and get statistical information on all topics.
You can see everything in a tabular chart, with clean breakdown structure.
Business Intelligence app offers you the best tools for keeping track and clean overview of all your important data.
In comparison with other examples of such app on the market, Odoo offers you great, user-friendly, simple, fast and fully integrated software.
Fully Integrated with Odoo Apps
Get hundreds of open source apps for free
Project Management
Enable your project right way Step by step get work done.
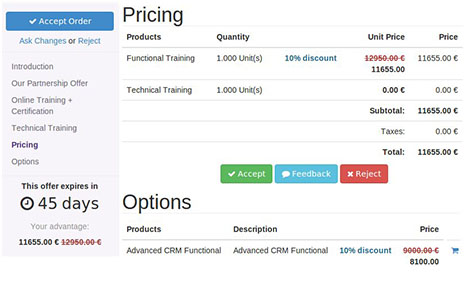
Quote Builder
Create polished, professional proposals in minutes and let customers sign online.

e-Commerce
Boost your online sales with sleek product pages.
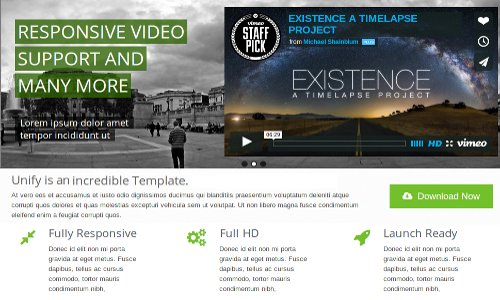
Website Builder
Get an awesome enterprise website. Fully customizable and SEO friendly.